Consumers today have access to a wider array of products than ever before, thanks to globalisation and connectivity. So when it comes to country of origin, just how much does being a ‘local’ or ‘global’ brand influence the purchasing behaviour of consumers in Australia and New Zealand?
The annual Nielsen Global Brand-Origin Report highlights consumers’ preference for, and sentiment toward, products manufactured by local manufacturers versus large global/multinational brands across 34 categories.
Around the world and across the Pacific, the dairy category (milk, butter, cheese and yoghurt) comes out on top as having the strongest consumer preference for local brands. More than half of all consumers opt for local dairy brands, highlighting the importance of sourcing perishable goods as close to the place of origin as possible, due to concerns over freshness and quality. Increased awareness and focus on the benefits of supporting our local dairy farmers, particularly in Australia in recent years, may also be contributing to consumer preference for local brands in this category.
Conversely, preference for global brands was strongest in categories such as baby care. Just 9% of Australians and 10% of Kiwis say they prefer to buy locally-branded baby formula; while less than one-in-10 consumers across the Pacific prefer to buy baby wipes and nappies from these global brands. With the growth of the Daigou industry, shortages of formula have made headlines in Australia. Daigous have been scooping up products such as baby formula from the shelves of Australian retailers on behalf of customers in mainland China. These customers are willing to pay a price premium for high quality and genuine globally branded products from overseas markets like Australia and New Zealand.
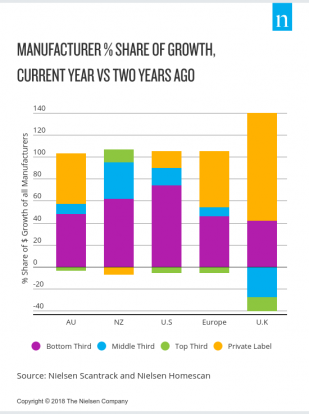 A consumer’s preference, regardless of brand origin, can be as simple as understanding the consumer’s needs. In New Zealand, of all the suppliers in the grocery channel, the bottom third of suppliers (making up the bottom third of value sales) are the ones that are contributing the most to share of dollar growth versus two years ago. These suppliers are contributing to a staggering 62% of total grocery growth. This growth is driven largely by the flexibility of local suppliers when launching new products that address consumer needs. Conversely, many global/multinational suppliers launch new products available through global/regional hubs, which may not be as suitable to local consumers. In Australia, the majority of the growth is coming from suppliers making up the bottom third of dollar sales (contributing 48% of the dollar growth) as well as private label brands (46% of the growth) as retailers use these brands to differentiate their shelf and to address key consumer trends in the marketplace.
In an increasingly global world, the battle of the brands comes down to understanding consumers’ evolving needs, behaviours, lifestyles and tastes. Any brand, be it local or global, that is able to tap into these consumer preferences will be best-placed to win the hearts and minds of consumers in the future.
About The Nielsen Global Brand-Origin Survey
The Nielsen Global Brand-Original Survey polled more than 31,500 online respondents in 63 countries to understand brand preferences for global/multinational brands (defined as those that operate in many markets) versus local players (those operating only in a single market—the respondent’s home country). The online survey was conducted May 20 to June 10, 2017. While an online survey methodology allows for tremendous scale and global reach, it provides a perspective only on the habits of existing internet users, not total populations. In developing markets where online penetration is still growing, audiences may be younger and more affluent than the general population of that country. In addition, survey responses are based on claimed behaviour, rather than actual metered data. Cultural differences in reporting sentiment are likely factors in the measurement of economic outlook across countries. The reported results do not attempt to control or correct for these differences; therefore, caution should be exercised when comparing across countries and regions, particularly across regional boundaries.
For further information, please contact: bashar.basheer@nielsen.com